


Vue图表组件中Cavans画布大小如何自定义调整
0

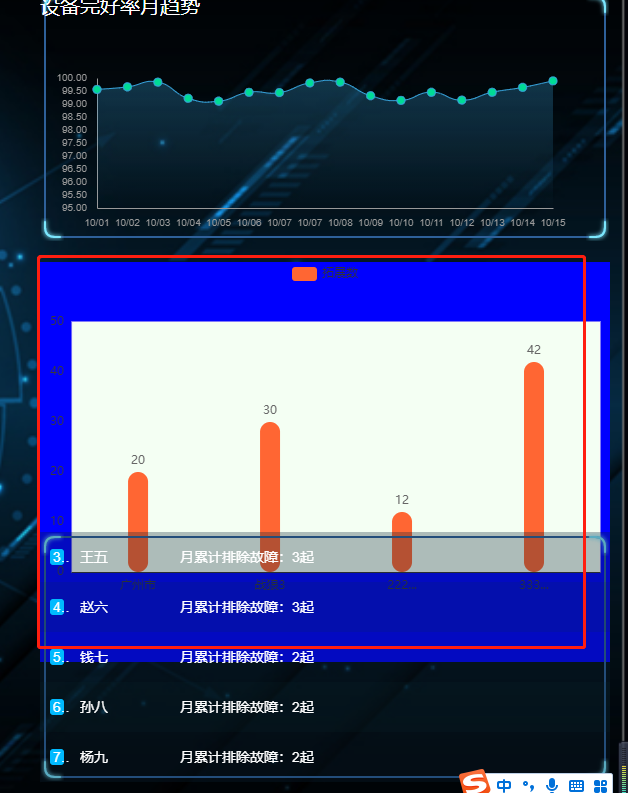
因为项目需求,使用了V-Charts中的柱形图,但是在柱形图的外层还有一层Cavans,但是代码里并没有这个画布的代码,应该是组件自动带出的,现在想要调整这个来历不明的Cavans请问如何调整大小,下面附上代码和图片
<template>
<ve-histogram
:data="chartData"
:settings="vchartsConfig.setting"
:extend="vchartsConfig.extend"
></ve-histogram>
</template>
<script type="text/javascript">
export default {
name: 'dataTwoRight',
data() {
return {
// v-charts配置参数
vchartsConfig: {
setting: {
// 别称
labelMap: {
'area': '地区',
'count': '拓展数',
},
},
extend: {
title: {
show: false,
text: '实时数据',
subtext: '各城市对应的拓展',
// textAlign:'center',
},
// 图标顶部的标题及按钮
legend: {
show: true
},
backgroundColor: 'blue',//整个组件的背景颜色
//backgroundSize: 30,
//height: 270,
//X轴线
xAxis: {
// name: "地区",
type: 'category',
show: true,
// 坐标轴轴线
axisLine: {
show: true,
},
// 坐标轴刻度
// axisTick: {
// show: false,
// },
// 坐标轴每项的文字
axisLabel: {
showMaxLabel: true,
showMinLabel: true,
color: '#3a3a3a',
rotate: 0, //刻度文字旋转,防止文字过多不显示
margin: 8,//文字离x轴的距离
boundaryGap: true,
// backgroundColor:'#0f0',
formatter: (v) => {
// console.log('x--v',v)
if (v.length > 3) {
return v.substring(0, 3) + '...'
}
return v
},
},
// X轴下面的刻度小竖线
axisTick: {
show: false,
alignWithLabel: true,//axisLabel.boundaryGap=true时有效
interval: 0,
length: 4,//长度
},
// x轴对应的竖线
splitLine: {
show: false,
interval: 0,
lineStyle: {
color: 'red',
backgroundColor: 'red',
}
}
},
yAxis: {
show: true,
offset: 0,
// 坐标轴轴线
axisLine: {
show: false,
},
// x轴对应的竖线
splitLine: {
show: false,
},
// 坐标轴刻度
axisTick: {
show: false,
},
boundaryGap: false,
axisLabel: {
color: '#3a3a3a',
},
},
      // 滚动组件参数
      dataZoom: [
        {
          type: 'inside',
          show: true,
          xAxisIndex: [0],
          startValue: 0,
          endValue: 4,
          zoomLock: false,//阻止区域缩放
        }
      ],

      // 柱形区域
      grid: {
        show: true,
        backgroundColor: "#f4fff3",
        borderColor: "#FFF6F3",
        height: 270
        // containLabel:false,
      },

      // 每个柱子
      series(v) {
        // console.log("v", v);
        // 设置柱子的样式
        v.forEach(i => {
          console.log("series", i);
          i.barWidth = 20;
          i.itemStyle = {
            barBorderRadius: [10, 10, 10, 10],
            color: '#FF6633',
            borderWidth: 0,
          };
          i.label = {
            color: '#666',
            show: true,
            position: 'top',
            // backgroundColor:'yellow',
          };

        });
        return v;
      },
    }
  },
  // v-chats列表数据
  chartData: {
    columns: ["area", "count"],
    rows: [
      {"area": "广州市", "count": 20},
      {"area": "战狼3", "count": 30},
      {"area": "2222", "count": 12},
      {"area": "3333", "count": 42},
    ],
  },
}
}
}
</script>


最佳答案
0
一般改父级就可以了吧
收获园豆:5
我改过父级,不生效,F12从页面中改是生效的,但是代码里没有<Cavans></Cavans>这个标签,应该是自动生成的,所以代码里我找不到这个标签,用JS去获取还报错,对前端不怎么了解,百度也没有符合我现在情况的解决方法,很苦恼
@丽丽圈养的老王: 我记得默认是根据父级的宽高来的,你改一下父级的宽高,子级应该会继承的
其他回答(1)
0
直接在<ve-histogram
:data="chartData"
:settings="vchartsConfig.setting"
:extend="vchartsConfig.extend"
</ve-histogram>中写明宽度和高度就可以处理解决,然后再根据父级元素大小进行位置的调整就可以了
