首页 新闻 会员 周边

echarts中的xAxis的data中数据显示不出来

0
[已解决问题] 解决于 2016-08-10 15:04

今天在做一个统计时,用到了echarts做图表,在静态页面中能展现出来,

如图:


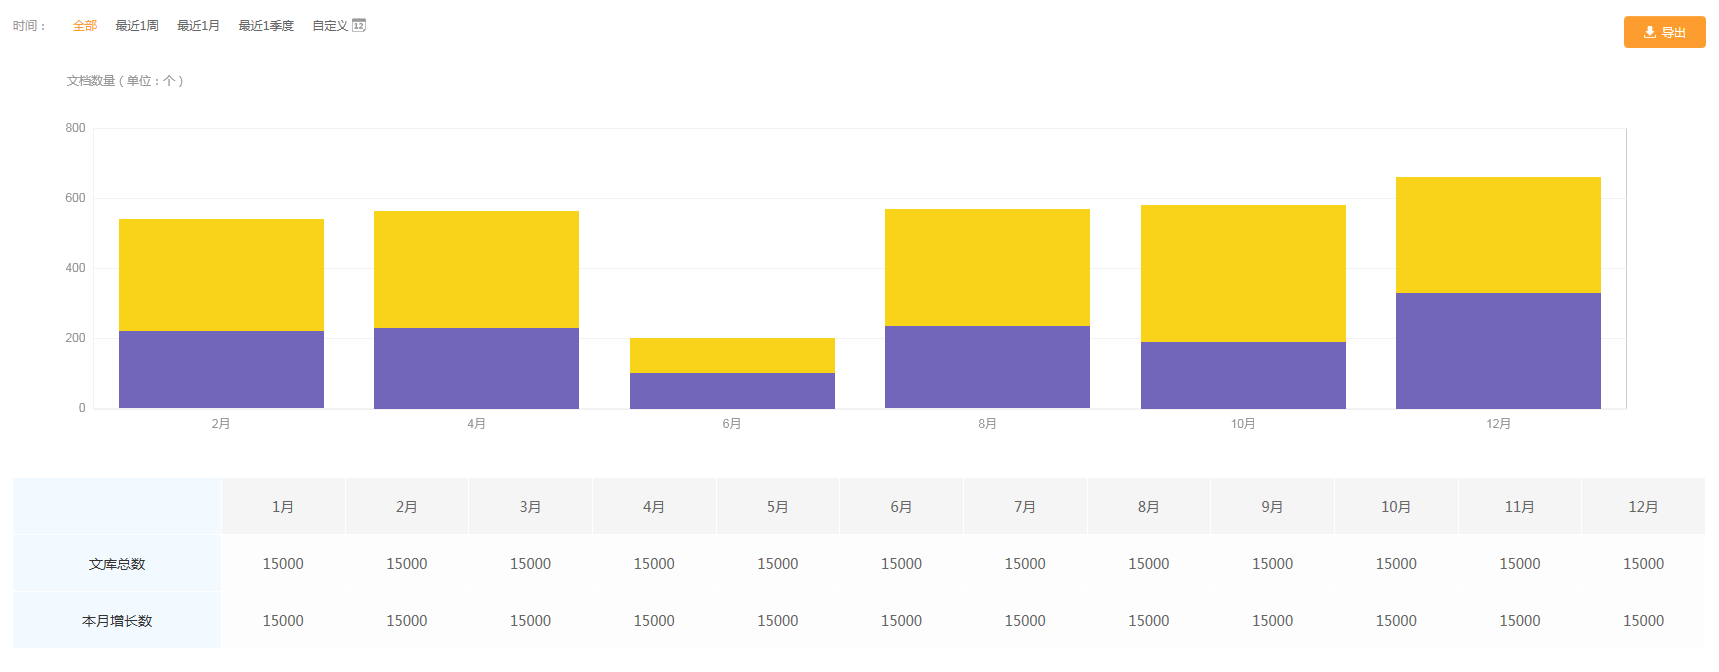
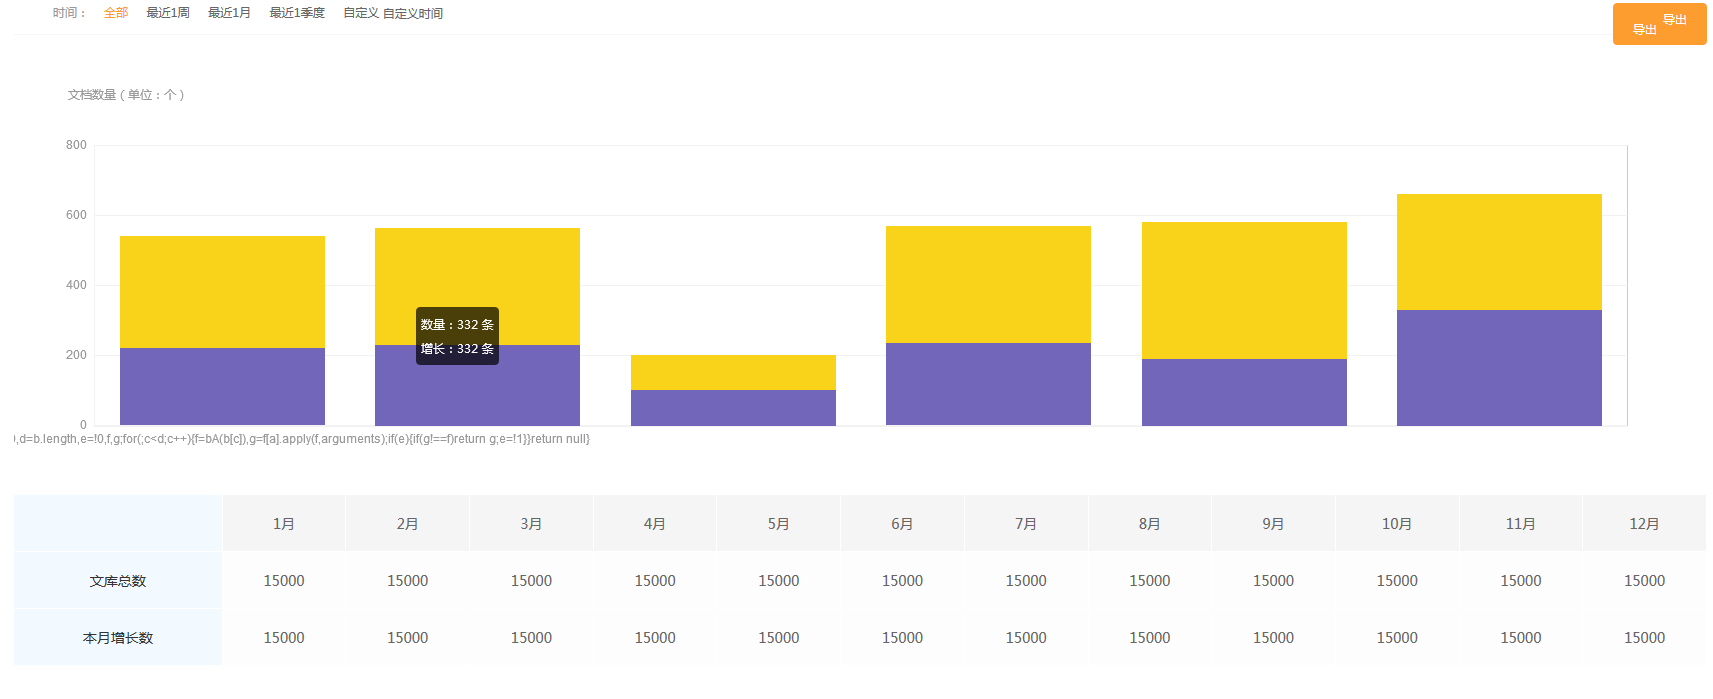
引到了项目中时 xAxis 中的 data数据却显示不出来了, 还显示了一段英文

如图所示:


JS代码:

<script type="text/javascript">
    (function(){
        // 路径配置
        require.config({
            paths: {
                echarts : WEB_URL + '/resources/js/echarts-2.2.7/build/dist'
            }
        });

        require(
            [
                'echarts',
                'echarts/chart/bar'   // 按需加载所需图表
            ],
            function (ec) {
                // 基于准备好的dom,初始化echarts图表
                var myChart1 = ec.init(document.getElementById('pro-price-main'));
                option1 = {
                     title : {
                        text: '文档数量(单位:个)',
                        textStyle: {
                            fontWeight: 'normal',
                            fontSize: '12',
                            color: '#999'
                        },
                        x: 54
                    },
                    tooltip : {
                        show: true,
                        trigger: 'item',
                        formatter : function (params) {
                            var value = params.value + '';
                            value = value.replace(/(\d{1,3})(?=(?:\d{3})+(?!\d))/g, '$1,');
                            return '数量:' + params.data + ' 条' + '<br/>' + '增长:' + value + ' 条';
                        }
                    },
                    calculable : true,
                    xAxis : [
                        {
                            type : 'category',
                            show: true,
                            splitLine: false,
                            axisLine: {
                                lineStyle: {
                                    width: 1,
                                    color: '#f2f2f2'
                                }
                            },
                            axisLabel: {
                                textStyle: {
                                    align: 'center',
                                    color: '#999'
                                }
                            },
                            axisTick: {
                                show: false
                            },
                            data : ['2月','4月','6月','8月','10月','12月']
                        }
                    ],
                    yAxis : [
                        {
                            type : 'value',
                            show: true,
                            splitLine: {
                                lineStyle: {
                                    color: ['#f2f2f2'],
                                    width: 1,
                                }
                            },
                            axisLine: {
                                lineStyle: {
                                    width: 1,
                                    color: '#f2f2f2'
                                }
                            },
                            axisLabel: {
                                textStyle: {
                                    color: '#999'
                                }
                            }
                        }
                    ],
                    series : [
                        {
                            name:'文库总数',
                            type:'bar',
                            stack: '总量',
                            data:[220, 232, 101, 234, 190, 330],
                            itemStyle: {
                                normal: {
                                    color: '#7266ba'
                                }
                            }
                        },
                        {
                            name:'文库增长数',
                            type:'bar',
                            stack: '总量',
                            itemStyle: {                // 系列级个性化
                                normal: {
                                    color: '#f9d21a'
                                }
                            },
                            data:[320, 332, 100, 334, 390, 330]
                        }
                    ]
                };


                // 为echarts对象加载数据
                myChart1.setOption(option1);
            }
        );
    })();

    </script>


各位大神有没有遇到同样的问题的,求指点

何甘霖的主页 何甘霖 | 菜鸟二级 | 园豆:204
提问于:2016-08-08 17:39
< >
分享
最佳答案
0

已解决,是因为别的js代码干扰了

何甘霖 | 菜鸟二级 |园豆:204 | 2016-08-10 15:03

哥们  在不??  我有问题请教

JAMESCL | 园豆:200 (初学一级) | 2016-11-16 15:41

加我qq吧   56708501

JAMESCL | 园豆:200 (初学一级) | 2016-11-16 15:42
清除回答草稿
   您需要登录以后才能回答,未注册用户请先注册