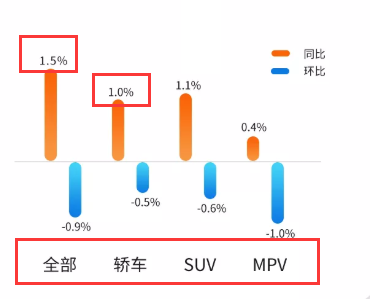
如何设置echarts柱状图两组不同的数据错开显示,目前他们时在一起重叠显示的?
0
[待解决问题]


//同比环比
var myChart= echarts.init(document.getElementById('bar_chart'));
var xAxisData = ['全部','轿车','SUV','MPV'];
var data1 = [1.03,0.44,0.88,0.67]; //同比
var data2 = [-0.4,-0.56,-0.67,-0.53];//环比
option = {
legend: {
itemWidth:15,
itemHeight:4,
fontSize:12,
data: ['同比', '环比'],
right: 55,
top:10,
orient: 'vertical',
},
tooltip: {},
// 设置图标距离上下左右的距离
grid: {
    top: 75,
    left:10,
    right:50,

},
xAxis: {

    type: 'category',
    //x轴文字配置
    axisLabel: {
        show: true,
        inside:false,
        // align:'left',
        margin:20,
        textStyle: {
            color: '#1a1a1a',
            fontSize: '14'
        }
    },
    axisTick: {
        show: false
    }, //去掉x轴刻度线
    data:[],
    axisLine: {
        show: true,
        length:2,
        lineStyle:{
            color:"#B5B2B5"
        },
    }
},
yAxis: {
    //y轴不显示
    show:false,
    inverse: false,//是否反向坐标
    axisLine: {
        show: false,
    },
    // y轴刻度不显示
    axisLabel : {
        formatter: function(){
              return "";
        }
    },
    splitLine:{
        show:false
    },
    splitArea: {show: false}
},
series: [
    {
        name: '同比',
        type: 'bar',
        barGap: '-100%',
        barWidth: '15%',
        stack: 'one',
        data: [],
        itemStyle: {
            normal: {
                label: {
                    show: true,     //开启显示
                    position: 'top',    //在上方显示
                    formatter: '{c}%',//每一项加%
                    textStyle: {        //数值样式
                        color: '#1a1a1a',
                        fontSize: 12
                    }
                },
                barBorderRadius: 100,
                color: new echarts.graphic.LinearGradient(
                    0, 1, 0, 0,
                    [{
                            offset: 0,
                             color: '#f89741'

                        },
                        {
                            offset: 1,
                             color: '#fa6206'
                        }
                    ]
                )
            }
        },
    }, {
        name: '环比',
        type: 'bar',
        barWidth: '15%',
        stack: 'one',
        data: [],
        itemStyle: {
            normal: {
                label: {
                    show: true,     //开启显示
                     position: 'bottom',    //在上方显
                    formatter: '{c}%',//每一项加%
                    textStyle: {        //数值样式
                        color: '#1a1a1a',
                        fontSize: 12
                    }
                },
                barBorderRadius: 100,
                color: new echarts.graphic.LinearGradient(
                    0, 1, 0, 0,
                    [{
                            offset: 0,
                            color: '#0c7be3'


                        },
                        {
                            offset: 1,
                             color: '#42d3f7'
                        }
                    ]
                )
            }
        },
    },

]
};
myChart.setOption(option);


