


js绘制图形问题?
0

//辅助函数
function $(id){return document.getElementByIdx(id)};

var Plot = {
    //画布,所有被画出来的元素都append到这个container
  container: null,
  //原点x
  ox: 500,
  //原点y
  oy: 300,
  //坐标颜色
  baseLineColor: 'black',
  //画笔颜色
  brushColor: 'red',
  //画笔粗细
  brushWeight: 1,
  //baseLineX,baseLineY保存坐标线,用于坐标移位
  baseLineX: null,
  baseLineY: null,

  //初始化方法,设置画布,原点位置,坐标线颜色,画笔颜色,画笔粗细
  init: function(containerId, ox, oy, baseLineColor,brushColor,brushWeight){
    if($(containerId)){
      Plot.container = $(containerId);
    }
    else{
      alert('You should specify an element in which you can draw plot!');
      return;
    }
    if((typeof ox)=='number'){
      Plot.ox = ox;
    }
    if((typeof oy)=='number'){
      Plot.oy = oy;
    }
    Plot.baseLineColor = baseLineColor;
    Plot.brushColor = brushColor;
    Plot.brushWeight = brushWeight;
    Plot.drawCoordinate();
  },
  //设置原点函数
  setOPoint: function(ox,oy){
    Plot.ox = ox;
    Plot.oy = oy;
    Plot.container.removeChild(Plot.baseLineX);
    Plot.container.removeChild(Plot.baseLineY);
    Plot.drawCoordinate();
  },
  //设置画笔粗细函数
  setBrushWeight: function(weight){
    Plot.brushWeight = weight;
  },
  setBrushColor: function(color){
    Plot.brushColor = color;
  },
  //画坐标线
  drawCoordinate: function(){
    var baseLineX = document.createElement_x('div');
    baseLineX.style.position = "absolute";
    baseLineX.style.left = 0;
    baseLineX.style.top = Plot.oy;
    baseLineX.style.fontSize = '1px';
    baseLineX.style.height = '1px';
    baseLineX.style.width = '100%';
    baseLineX.style.overflow = 'hidden'
    baseLineX.style.backgroundColor = Plot.baseLineColor;
    Plot.container.appendChild(baseLineX);
    Plot.baseLineX = baseLineX;
    var baseLineY = document.createElement_x('div');
    baseLineY.style.position = "absolute";
    baseLineY.style.left = Plot.ox;
    baseLineY.style.top = 0;
    baseLineY.style.fontSize = '1px';
    baseLineY.style.height = '100%';
    baseLineY.style.width = '1px';
    baseLineY.style.overflow = 'hidden'
    baseLineY.style.backgroundColor = Plot.baseLineColor;
    Plot.baseLineY = baseLineY;
    Plot.container.appendChild(baseLineY);
  },
  //清理画布,移走所有对象
  clean: function(){
    Plot.container.innerHTML ="";
    Plot.drawCoordinate();
  },
  //画点,相对原点
  drawDot: function(x,y){
    var dot = document.createElement_x('div');
    dot.style.left = Plot.ox + x + 'px';
    dot.style.top = Plot.oy - y + 'px';
    dot.style.height = Plot.brushWeight;
    dot.style.width = Plot.brushWeight;
    dot.style.position = 'absolute';
    dot.style.fontSize = '1px';
    dot.style.backgroundColor = Plot.brushColor;
    dot.style.overflow = "hidden";
    Plot.container.appendChild(dot);
    dot = null;
  },
  //sin函数曲线,传入角度,比如90,180,360
  sin: function(angle){
    for(var i=0; i<angle; i++){
      Plot.drawDot(i,Math.sin(i/180*Math.PI)*100);
    }
  },
  //tan函数曲线
  tan: function(){
    for(var i=0; i<720; i++){
      if(Math.tan(i/180*Math.PI)*100>Plot.oy){
        continue;
      }
      Plot.drawDot( i, Math.tan(i/180*Math.PI)*50 );
    }
  },
  //cos函数曲线,传入角度,比如90,180,360
  cos: function(angle){
    for(var i=0; i<angle; i++){
      Plot.drawDot(i,Math.cos(i/180*Math.PI)*100);
    }
  },
  //画线从(x0,y0)到(x1,y1)
  line: function(x0,y0,x1,y1){
    //竖线
    if((x1-x0)==0){
      for( var i=((y1>y0)?y0:y1); i<((y1>y0)?y1:y0); i++ ){
        Plot.drawDot(x1, i);
      }
      return;
    }
    //横线
    if((y1-y0)==0){
      for( var i=((x1>x0)?x0:x1); i<((x1>x0)?x1:x0); i++ ){
        Plot.drawDot(i, y1);
      }
      return;
    }
    //斜线
    //k=斜率,直线方程为y=kx + b
    var k = (y1-y0)/(x1-x0);
    if(k<=1){
      for(var i=((x1>x0)?x0:x1); i<((x1>x0)?x1:x0); i++){
        Plot.drawDot(i, k*i+y1-k*x1 );
      }
    }
    else{
      for(var i=((y1>y0)?y0:y1); i<((y1>y0)?y1:y0); i++){
        Plot.drawDot((i-y1+k*x1)/k,i);
      }
    }
    return;
  },
  //画圆,radius是半径,(xi,yi)为圆心
  circle: function(radius,xi, yi){
    if((typeof xi)=='undefined'){
      xi = 0;
    }
    if((typeof yi)=='undefined'){
      yi = 0;
    }
    //i为角度,从0到360
    var i=0;
    while(i<360){
      var _x0 = Math.sin(i/180*Math.PI)*radius;
      var _y0 = Math.cos(i/180*Math.PI)*radius;
      var step = radius/100;
      //随着半径的增大,划出来的圆周断断续续,下面的做法
      //使画圆周的点数随着半径的增大而增大,使画出来的圆周更圆润.
      if(1/step>1){
        step = 1;
      }
      else if(1/step<0.2){
        step = 0.2;
      }
      else{
        step = 1/step;
      }
      Plot.drawDot(_x0+xi, _y0+yi);
      i = i+ step;
    }

  },
  //画多边形,传入一个点列
  polygon: function(dots){
    if(typeof dots=='undefined'){
      alert('you should specify some dots to draw!');
      return;
    }
    if(dots.constructor!=Array){
      alert('you should specify some dots to draw!');
      return;
    }
    for(var i=0; i<dots.length-1; i++){
      Plot.line(dots[i].x,dots[i].y, dots[i+1].x,dots[i+1].y);
      if(i==1&&dots.length==2){
        break;
      }
    }
    Plot.line(dots[0].x, dots[0].y,  dots[dots.length-1].x, dots[dots.length-1].y);
  }
};
请问怎么使用这段代码绘制出图形?

最佳答案
1
绘制出的是这个样子:
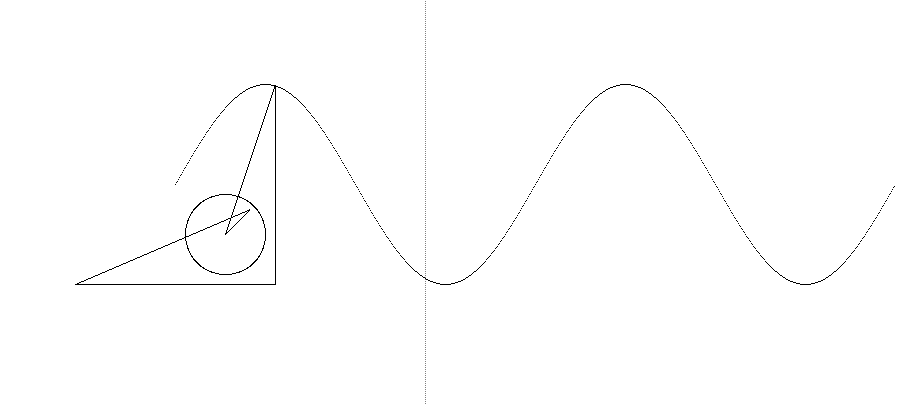
getElementByIdx改为getElementById
createElement_x改为createElement
绘制图形在下面的第二个script里
<!DOCTYPE html>
<html>
<head>
    <meta http-equiv="Content-Type" content="text/html; charset=UTF-8">
    <title></title>
</head>
<body>

    <div id="div1" style="width:500px; height:500px;border:1px dotted gray; position:absolute;">

    </div>

    <script>
        //辅助函数
        function $(id) { return document.getElementById(id) };

        var Plot = {
            //画布,所有被画出来的元素都append到这个container
            container: null,
            //原点x
            ox: 500,
            //原点y
            oy: 300,
            //坐标颜色
            baseLineColor: 'black',
            //画笔颜色
            brushColor: 'red',
            //画笔粗细
            brushWeight: 1,
            //baseLineX,baseLineY保存坐标线,用于坐标移位
            baseLineX: null,
            baseLineY: null,

            //初始化方法,设置画布,原点位置,坐标线颜色,画笔颜色,画笔粗细
            init: function (containerId, ox, oy, baseLineColor, brushColor, brushWeight) {
                if ($(containerId)) {
                    Plot.container = $(containerId);
                }
                else {
                    alert('You should specify an element in which you can draw plot!');
                    return;
                }
                if ((typeof ox) == 'number') {
                    Plot.ox = ox;
                }
                if ((typeof oy) == 'number') {
                    Plot.oy = oy;
                }
                Plot.baseLineColor = baseLineColor;
                Plot.brushColor = brushColor;
                Plot.brushWeight = brushWeight;
                Plot.drawCoordinate();
            },
            //设置原点函数
            setOPoint: function (ox, oy) {
                Plot.ox = ox;
                Plot.oy = oy;
                Plot.container.removeChild(Plot.baseLineX);
                Plot.container.removeChild(Plot.baseLineY);
                Plot.drawCoordinate();
            },
            //设置画笔粗细函数
            setBrushWeight: function (weight) {
                Plot.brushWeight = weight;
            },
            setBrushColor: function (color) {
                Plot.brushColor = color;
            },
            //画坐标线
            drawCoordinate: function () {
                var baseLineX = document.createElement('div');
                baseLineX.style.position = "absolute";
                baseLineX.style.left = 0;
                baseLineX.style.top = Plot.oy;
                baseLineX.style.fontSize = '1px';
                baseLineX.style.height = '1px';
                baseLineX.style.width = '100%';
                baseLineX.style.overflow = 'hidden'
                baseLineX.style.backgroundColor = Plot.baseLineColor;
                Plot.container.appendChild(baseLineX);
                Plot.baseLineX = baseLineX;
                var baseLineY = document.createElement('div');
                baseLineY.style.position = "absolute";
                baseLineY.style.left = Plot.ox;
                baseLineY.style.top = 0;
                baseLineY.style.fontSize = '1px';
                baseLineY.style.height = '100%';
                baseLineY.style.width = '1px';
                baseLineY.style.overflow = 'hidden'
                baseLineY.style.backgroundColor = Plot.baseLineColor;
                Plot.baseLineY = baseLineY;
                Plot.container.appendChild(baseLineY);
            },
            //清理画布,移走所有对象
            clean: function () {
                Plot.container.innerHTML = "";
                Plot.drawCoordinate();
            },
            //画点,相对原点
            drawDot: function (x, y) {
                var dot = document.createElement('div');
                dot.style.left = Plot.ox + x + 'px';
                dot.style.top = Plot.oy - y + 'px';
                dot.style.height = Plot.brushWeight;
                dot.style.width = Plot.brushWeight;
                dot.style.position = 'absolute';
                dot.style.fontSize = '1px';
                dot.style.backgroundColor = Plot.brushColor;
                dot.style.overflow = "hidden";
                Plot.container.appendChild(dot);
                dot = null;
            },
            //sin函数曲线,传入角度,比如90,180,360
            sin: function (angle) {
                for (var i = 0; i < angle; i++) {
                    Plot.drawDot(i, Math.sin(i / 180 * Math.PI) * 100);
                }
            },
            //tan函数曲线
            tan: function () {
                for (var i = 0; i < 720; i++) {
                    if (Math.tan(i / 180 * Math.PI) * 100 > Plot.oy) {
                        continue;
                    }
                    Plot.drawDot(i, Math.tan(i / 180 * Math.PI) * 50);
                }
            },
            //cos函数曲线,传入角度,比如90,180,360
            cos: function (angle) {
                for (var i = 0; i < angle; i++) {
                    Plot.drawDot(i, Math.cos(i / 180 * Math.PI) * 100);
                }
            },
            //画线从(x0,y0)到(x1,y1)
            line: function (x0, y0, x1, y1) {
                //竖线
                if ((x1 - x0) == 0) {
                    for (var i = ((y1 > y0) ? y0 : y1) ; i < ((y1 > y0) ? y1 : y0) ; i++) {
                        Plot.drawDot(x1, i);
                    }
                    return;
                }
                //横线
                if ((y1 - y0) == 0) {
                    for (var i = ((x1 > x0) ? x0 : x1) ; i < ((x1 > x0) ? x1 : x0) ; i++) {
                        Plot.drawDot(i, y1);
                    }
                    return;
                }
                //斜线
                //k=斜率,直线方程为y=kx + b
                var k = (y1 - y0) / (x1 - x0);
                if (k <= 1) {
                    for (var i = ((x1 > x0) ? x0 : x1) ; i < ((x1 > x0) ? x1 : x0) ; i++) {
                        Plot.drawDot(i, k * i + y1 - k * x1);
                    }
                }
                else {
                    for (var i = ((y1 > y0) ? y0 : y1) ; i < ((y1 > y0) ? y1 : y0) ; i++) {
                        Plot.drawDot((i - y1 + k * x1) / k, i);
                    }
                }
                return;
            },
            //画圆,radius是半径,(xi,yi)为圆心
            circle: function (radius, xi, yi) {
                if ((typeof xi) == 'undefined') {
                    xi = 0;
                }
                if ((typeof yi) == 'undefined') {
                    yi = 0;
                }
                //i为角度,从0到360
                var i = 0;
                while (i < 360) {
                    var _x0 = Math.sin(i / 180 * Math.PI) * radius;
                    var _y0 = Math.cos(i / 180 * Math.PI) * radius;
                    var step = radius / 100;
                    //随着半径的增大,划出来的圆周断断续续,下面的做法
                    //使画圆周的点数随着半径的增大而增大,使画出来的圆周更圆润.
                    if (1 / step > 1) {
                        step = 1;
                    }
                    else if (1 / step < 0.2) {
                        step = 0.2;
                    }
                    else {
                        step = 1 / step;
                    }
                    Plot.drawDot(_x0 + xi, _y0 + yi);
                    i = i + step;
                }

            },
            //画多边形,传入一个点列
            polygon: function (dots) {
                if (typeof dots == 'undefined') {
                    alert('you should specify some dots to draw!');
                    return;
                }
                if (dots.constructor != Array) {
                    alert('you should specify some dots to draw!');
                    return;
                }
                for (var i = 0; i < dots.length - 1; i++) {
                    Plot.line(dots[i].x, dots[i].y, dots[i + 1].x, dots[i + 1].y);
                    if (i == 1 && dots.length == 2) {
                        break;
                    }
                }
                Plot.line(dots[0].x, dots[0].y, dots[dots.length - 1].x, dots[dots.length - 1].y);
            }
        };
    </script>

    <script type="text/javascript">
        //初始化
        Plot.init('div1', 250, 250, 'black', 'black', '1px');

        //画圈圈
        Plot.circle(40, 50, -50);

        //画sin曲线
        for (var angle = 90; angle <= 720; angle += 90) {
            Plot.sin(angle);
        }

        //画折线
        Plot.polygon([
            { x: -100, y: -100 },
            { x: 100, y: -100 },
            { x: 100, y: 100 },
            { x: 50, y: -50 },
            { x: 75, y: -25 }
        ]);

    </script>

</body>

</html>
收获园豆:5
非常感谢!
