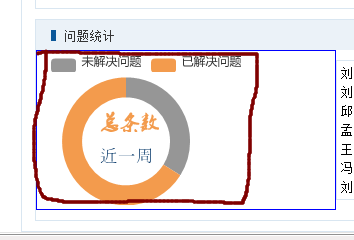
为什么我的echart饼形图不自适应容器大小,,求大神指点!!!!!!
0

下图红色圈为容器大小,蓝色圈为echarts饼形图大小,我已使用
window.onresize = myChart.resize;然并卵

下图为我查看的源代码

<div id="sty2">
<div id="huan" style="float:left;width:200px;height:160px;">
</div>
<div id="kuang" style="float:right;border:1px solid #d9e6f1;width:270px;height:140px;margin-top:10px;overflow:auto;">
<div id="huan" style="float:left;width:200px;height:160px;">
</div>
<div id="kuang" style="float:right;border:1px solid #d9e6f1;width:270px;height:140px;margin-top:10px;overflow:auto;">
</div>
</div>
<script type="text/javascript">
var oldDiv = document.getElementById('huan');
/*oldDiv.style.width = '200px';
oldDiv.style.width = '165px';*/
var myChart = echarts.init(oldDiv);
var option =({
title: {
text: '总条数',
textStyle: {
fontSize:'20px',
color:'#f39b4d'
},
subtext: ['近一周\n'],
subtextStyle:{
fontSize:'18px',
color: '#003366'
},
/*itemGap:'50px',*/
x: '58px',
y: 'center'
},
tooltip: {
trigger: 'item',
padding:'10',
formatter: "{a} <br/>{b}: {c} ({d}%)"
},
legend: {
orient: 'horizontal',
x: '10px',
data:['未解决问题','已解决问题']
},
color:['#969696','#f39b4d'],
series: [
{
name:'访问来源',
type:'pie',
radius: ['55%', '80%'],
avoidLabelOverlap: false,
center:['30%','57%'],
label: {
normal: {
show: false,
position: 'center'
},
emphasis: {
show: true,
textStyle: {
fontSize: '0',
fontWeight: 'bold'
}
}
},
labelLine: {
normal: {
show: true
}
},
data:[
{value:310, name:'未解决问题'},
{value:605, name:'已解决问题'}
]
}
]
});
window.onresize = myChart.resize;
myChart.setOption(option);
</script>
最佳答案
0
center : ['33.5%', '40%'],//圆心坐标(div中的%比例)
收获园豆:10


